Let’s shift ideas into action…
Develop skills…
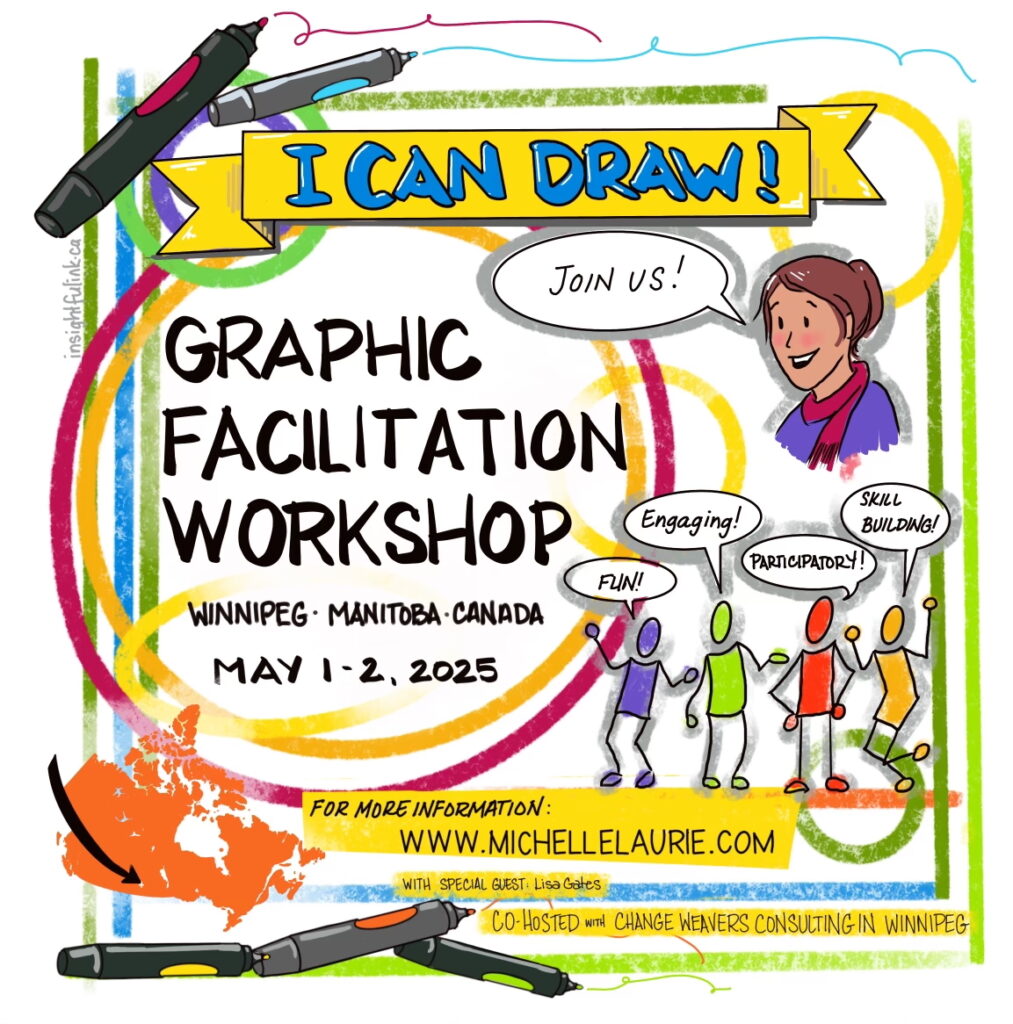
May 1-2, 2025, Winnipeg, Canada
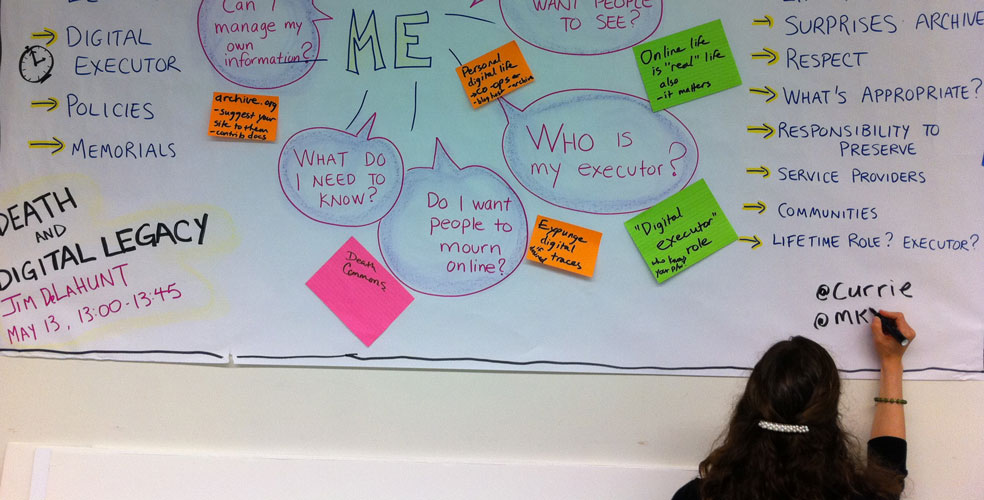
Graphic Facilitation Workshop
2026 date coming soon.
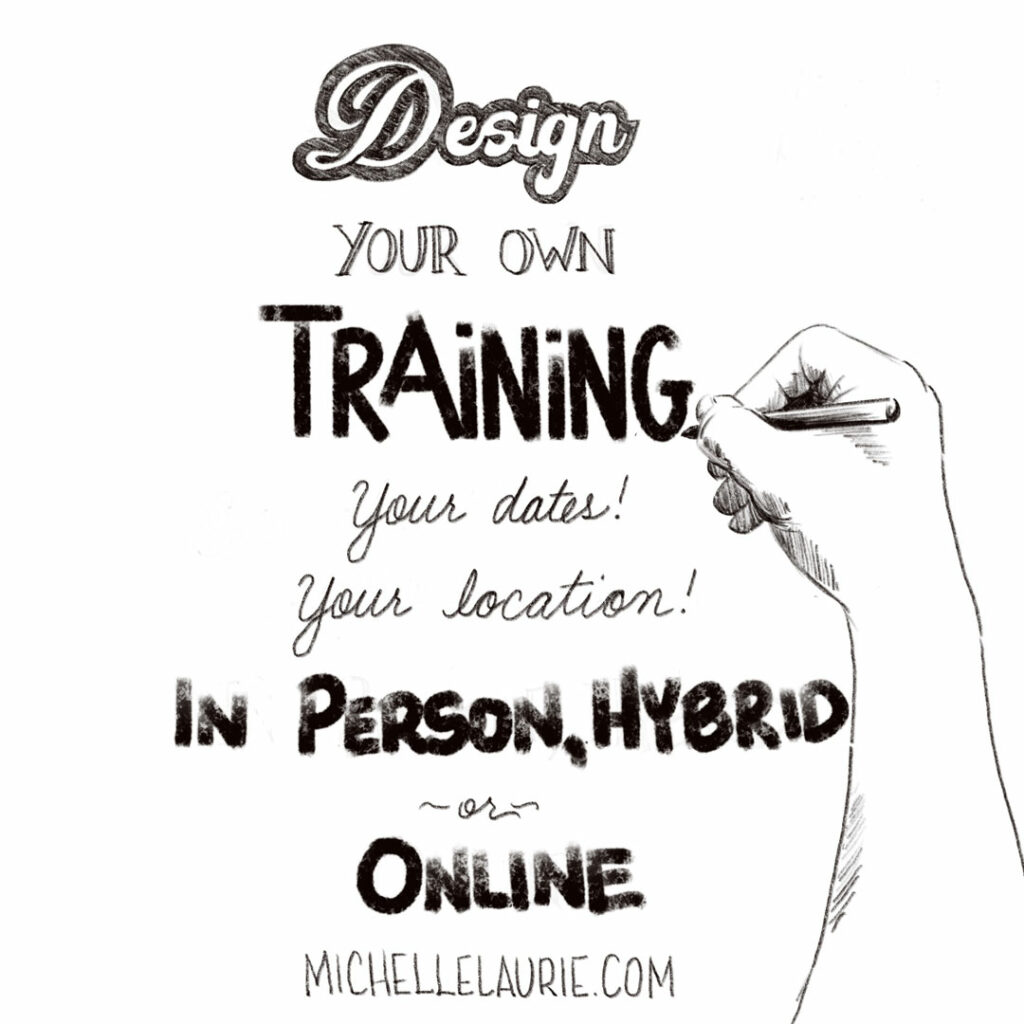
Design your own
What clients are saying…
Collective Wisdom of People
Michelle is an amazing force in harnessing the collective wisdom of people, online and face to face. I have been a participant at events she facilitated, and a customer when she designed and facilitated for me. I especially appreciate her ability to anticipate how individual activities will unfold. Frequently, her design work involved being a sounding board for me where further distilling and sharpening of objectives for an event were needed. As a facilitator, she makes everyone feel heard and her competence allows me to focus on the learning process rather than worry about details. Working with Michelle produces excellent outcomes and outputs.
Stephan Gruber
Professor, Carleton University
Relevant and Innovative
I hired Michelle to design and deliver a training on graphic facilitation for First Nations community engagement coordinators who work in rural and remote communities (2018). The training was fantastic focusing on relevant and innovative techniques. She worked well with the culturally diverse group as a highly skilled facilitator as well as sharing these skills with the participants. I recommend the training to others and hope to engage her again with our work in the North.
Patricia Howard
Manager Community Engagement, First Nations Health Authority
Expert Advice and Support
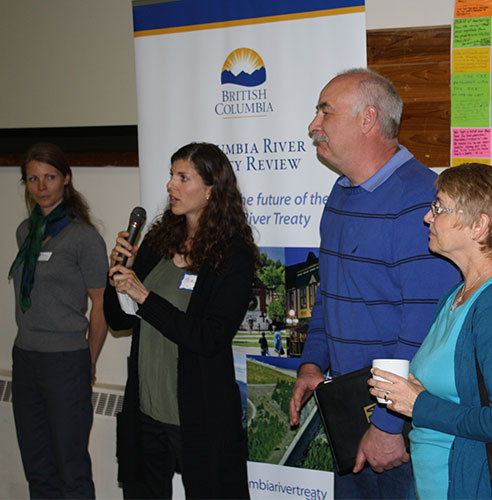
Michelle has provided expert advice and support to assist the Columbia Basin Trust (CBT) to be a leader on challenging and innovative projects/processes for more than a dozen years. In the early 2000’s when climate change was starting to be understood by governments and the scientific community Michelle designed multi-year strategic initiatives with more than twenty local governments and communities to help these communities understand what climate change is, how it may impact local communities and what type of actions these communities should consider to be more resilient or adapt to a range of future climate scenarios. Related to international water policy, Michelle helped develop cutting edge processes to help develop the capacity of community leaders, elected officials and staff to both understand the range of issues they were facing, how these impacted their various areas of authority and what tangible actions they could take.
Michelle has worked collaboratively with CBT and others and is willing and generous in sharing her skills. She has been supportive of CBT staff and the many partners our organization works with. She demonstrated great skill and knowledge in working with a variety of partners groups (including NGO’s, local governments, provincial governments, first nations and federal governments). She creatively designed and facilitated hundreds of meetings to strategize, learn together and engage people on tough topics. Additional highlights include facilitating the kick off meeting of government, utilities and First Nations where they agreed (for the first time ever) to work on reintroducing salmon to the Columbia River, assisting CBT staff to design a new organizational department for the Trust, and assessing long standing initiatives for learning and their evolution. She brings a broad wealth of skills and experience adding value to any team. Michelle is especially skilled helping to think through very complex multi layered issues and lay out very practical and useful frameworks for addressing this complexity. If you need help solving interesting complex problems Michelle Laurie is the person for your job!
Kindy Gosal
Executive Director, Special Initiatives, Columbia Basin Trust
Magical Experience
It was a magical experience!! Thank you Michelle for your generous spirit in making this a reality for us in the north.
Tess Healy
Adjunct Professor, University of Northern British Columbia
Innovative
The graphic facilitation workshop experience added a new and innovative method to my professional skill set. After the workshop, I was offered a job with a community design organization because my skills of community engagement are linked with visual interaction. I highly recommend the workshop to others!
Susan DeBlieck
Community Design Lab, Iowa State University & Workshop Participant
Instrumental Support
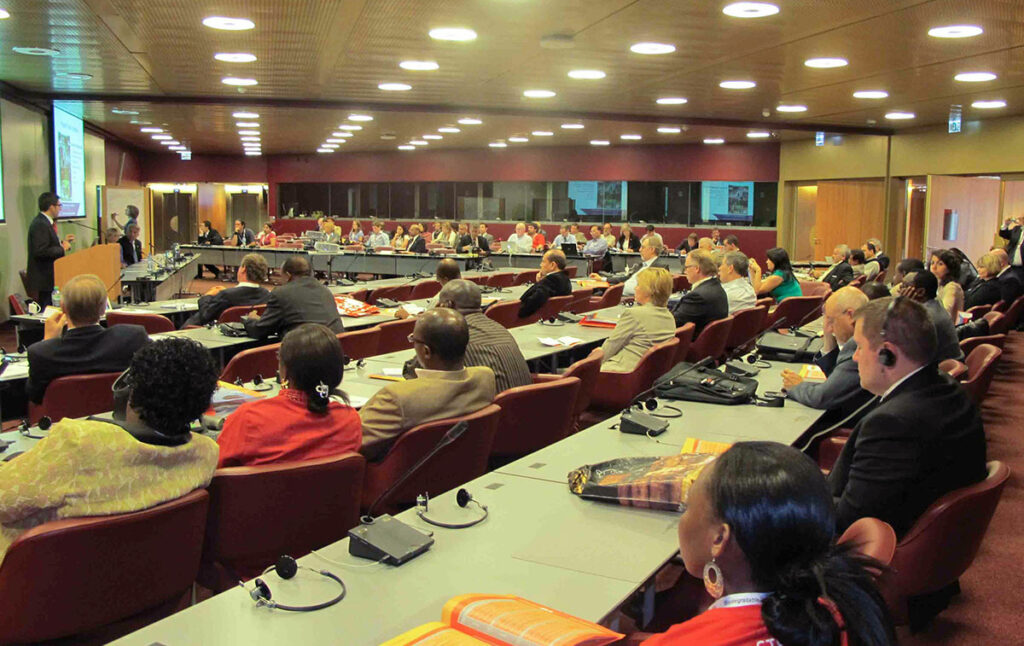
On behalf of Engineers Canada we are pulling together a session for the World Engineering Congress in Geneva Switzerland which will be held in 2011 September. The theme for our session is Climate Proofing Civil Infrastructure and builds on the work that has been ongoing within Engineer’s Canada for the past five years originating from the Public Infrastructure Engineering Vulnerability Committee.
The World’s Engineering Convention attracts engineers from around the world. Our session at this conference is meant to raise the profile of risk assessment, as well as adaptation and mitigation strategies for civil infrastructure.
Michelle has been instrumental in helping our steering committee pull this session together. She has helped us in liaison with the organizing committee from the conference, has researched a potential list of speakers, has contacted and gained commitments from all speakers and in general has helped gather together an entire program for our session including keynote speakers and panelists well ahead of the conference timelines.
Her skills are perfectly suited to the role of secretariat and she has consistently exceeded the needs of our steering committee. She has very strong skills in problem solving and has a focus on action and results. She brings an efficient set of facilitation skills to our team and a full range of leading ideas to add interest to our session. I wouldn’t hesitate to recommend Michelle Laurie for a similar role. I am looking forward to the opportunity to working with Michelle again in the future.
Paul Fesko
Former Manager of Strategic Services, City of Calgary and World Engineering Convention 2011 Session Chair
Learning along the way…
Reflective practice is a part of our DNA.
To be an entrepreneur

When your meeting is a flop…