I’m planning a meeting for May where a group of scientists will come together to plan their reporting on five years of study. In their case they have been monitoring glaciers and snow melt. I am tasked with helping bring together the different studies to come under one technical report. The report should help connect the work of everyone together to tell a bigger story (hopefully).
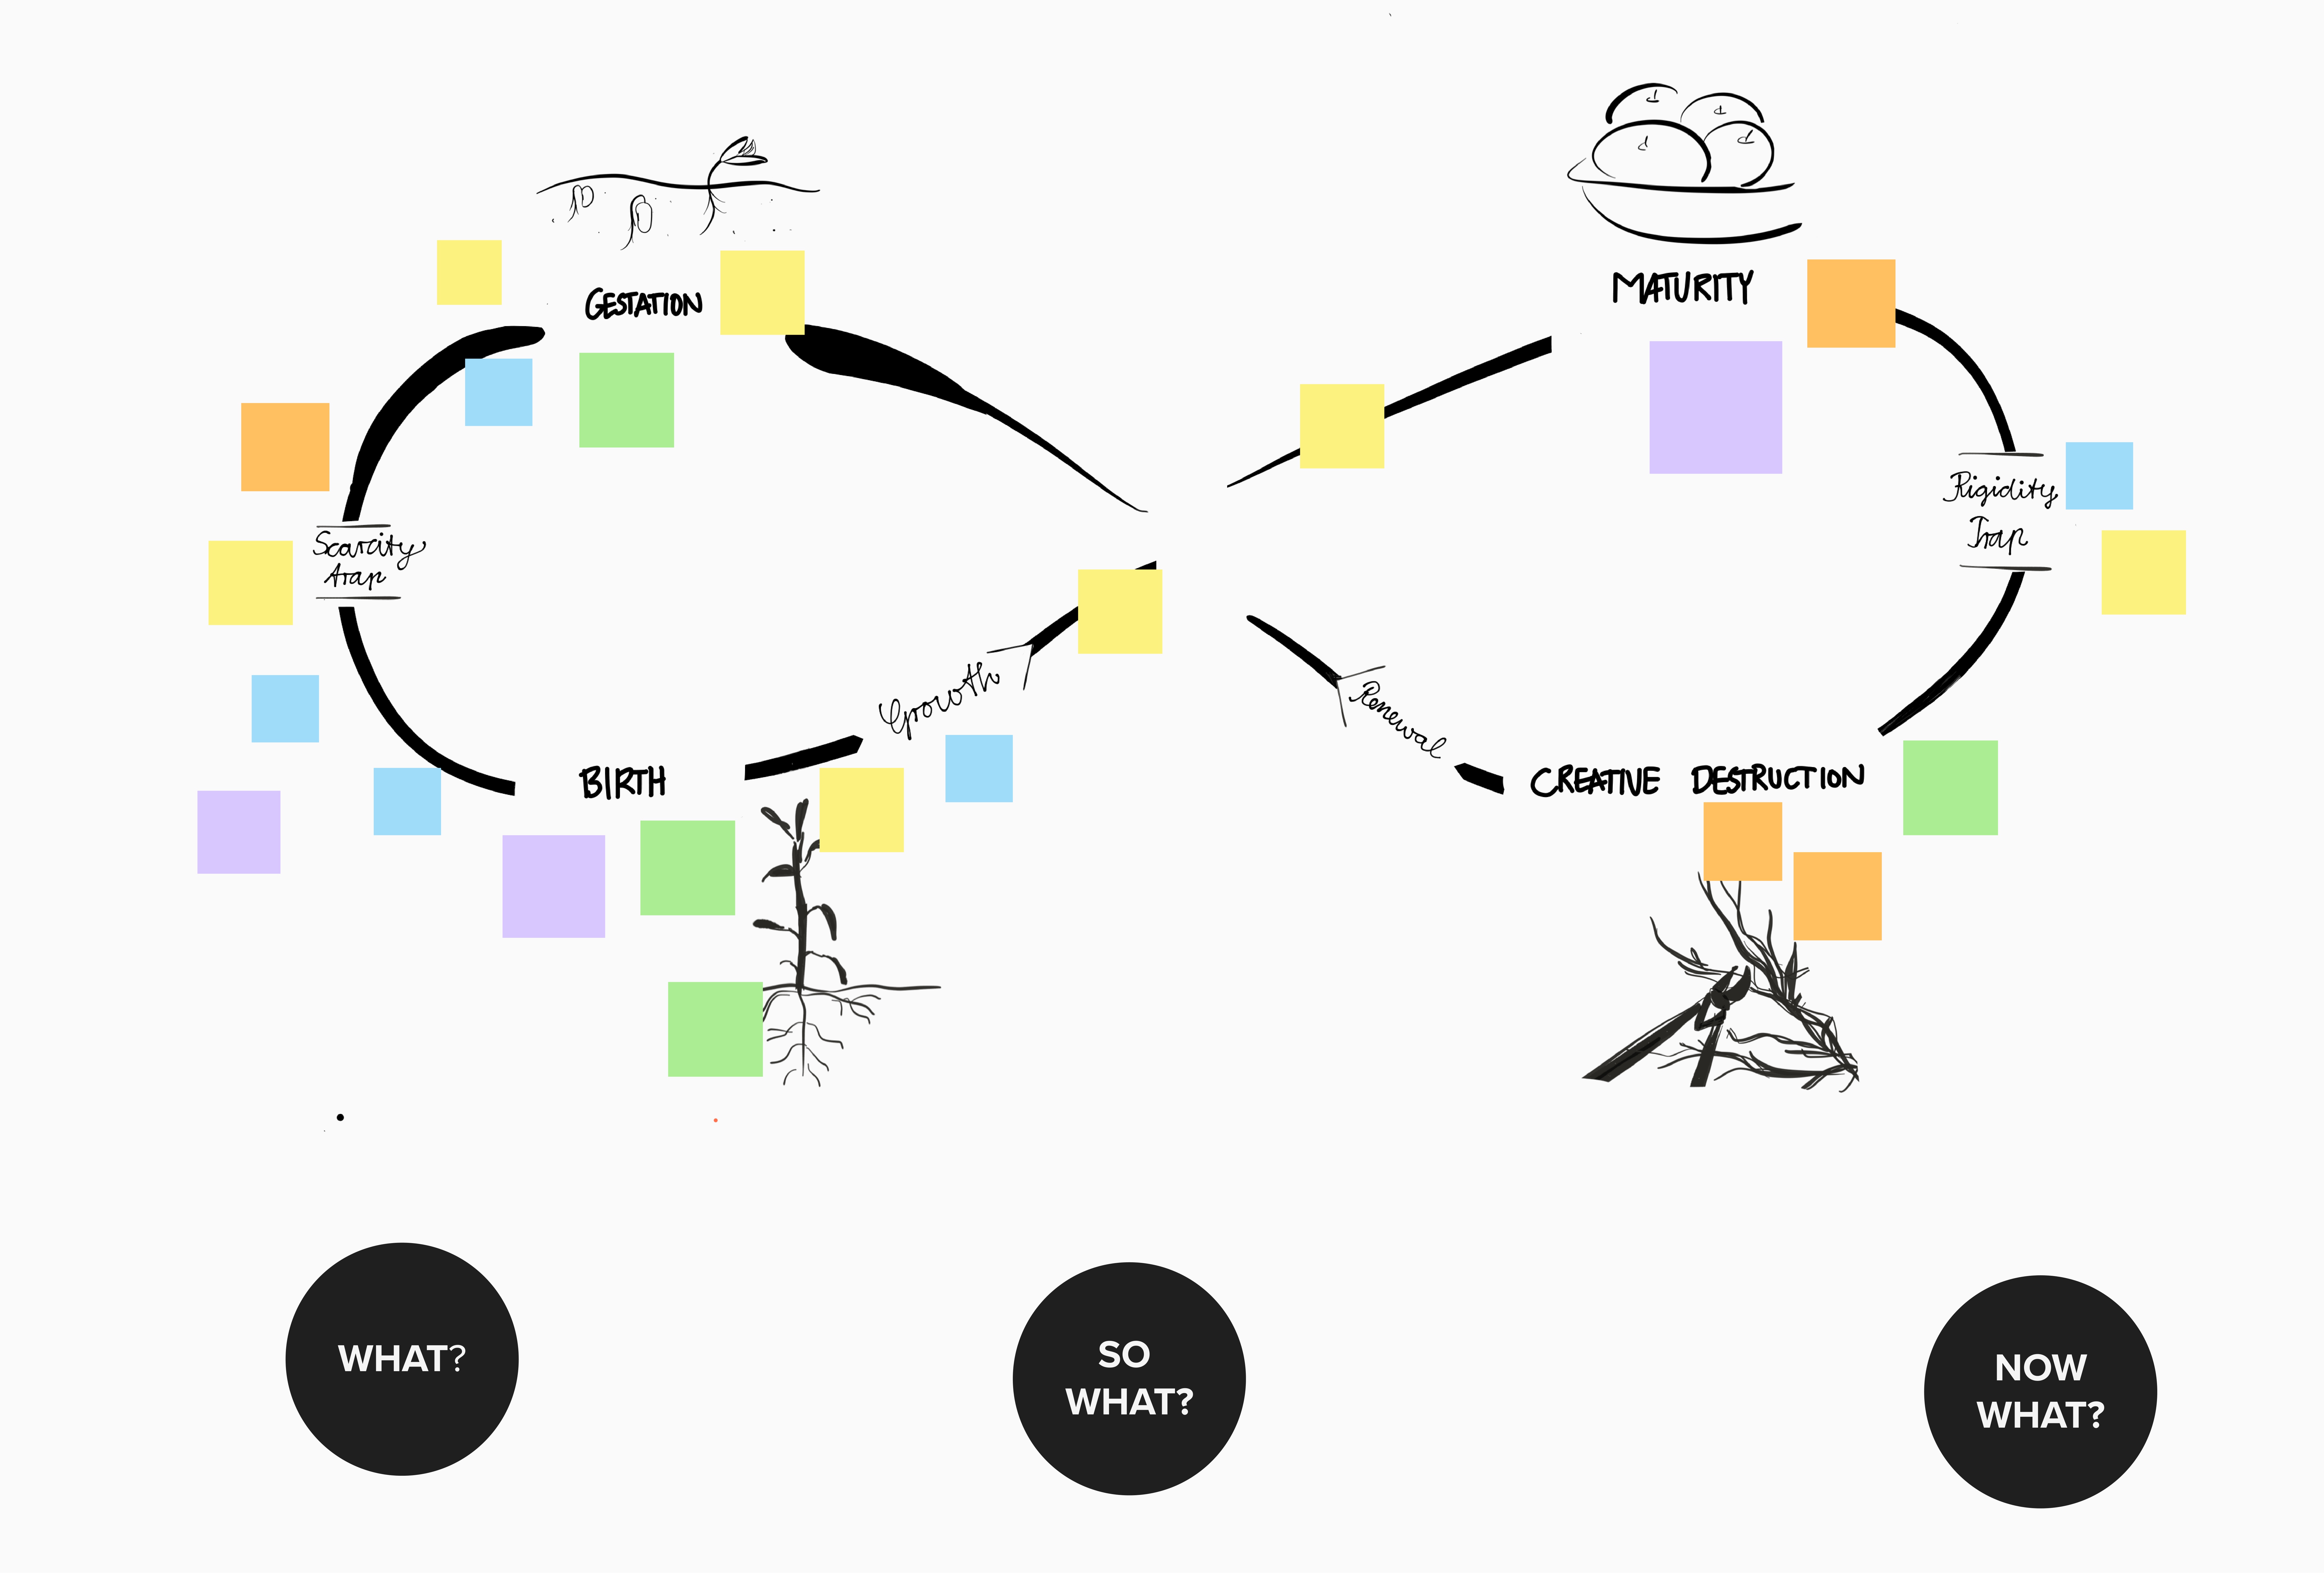
When looking at ways to think and write together, I surfed through the list serve of one of my favourite networks (www.km4dev.org) which is full of people who help bring knowledge beyond the individual. On one thread a variety of awesome tools were listed. These included using kanban boards, ecocycle planning and visual facilitation. Wow!
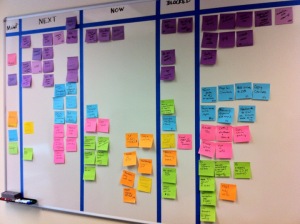
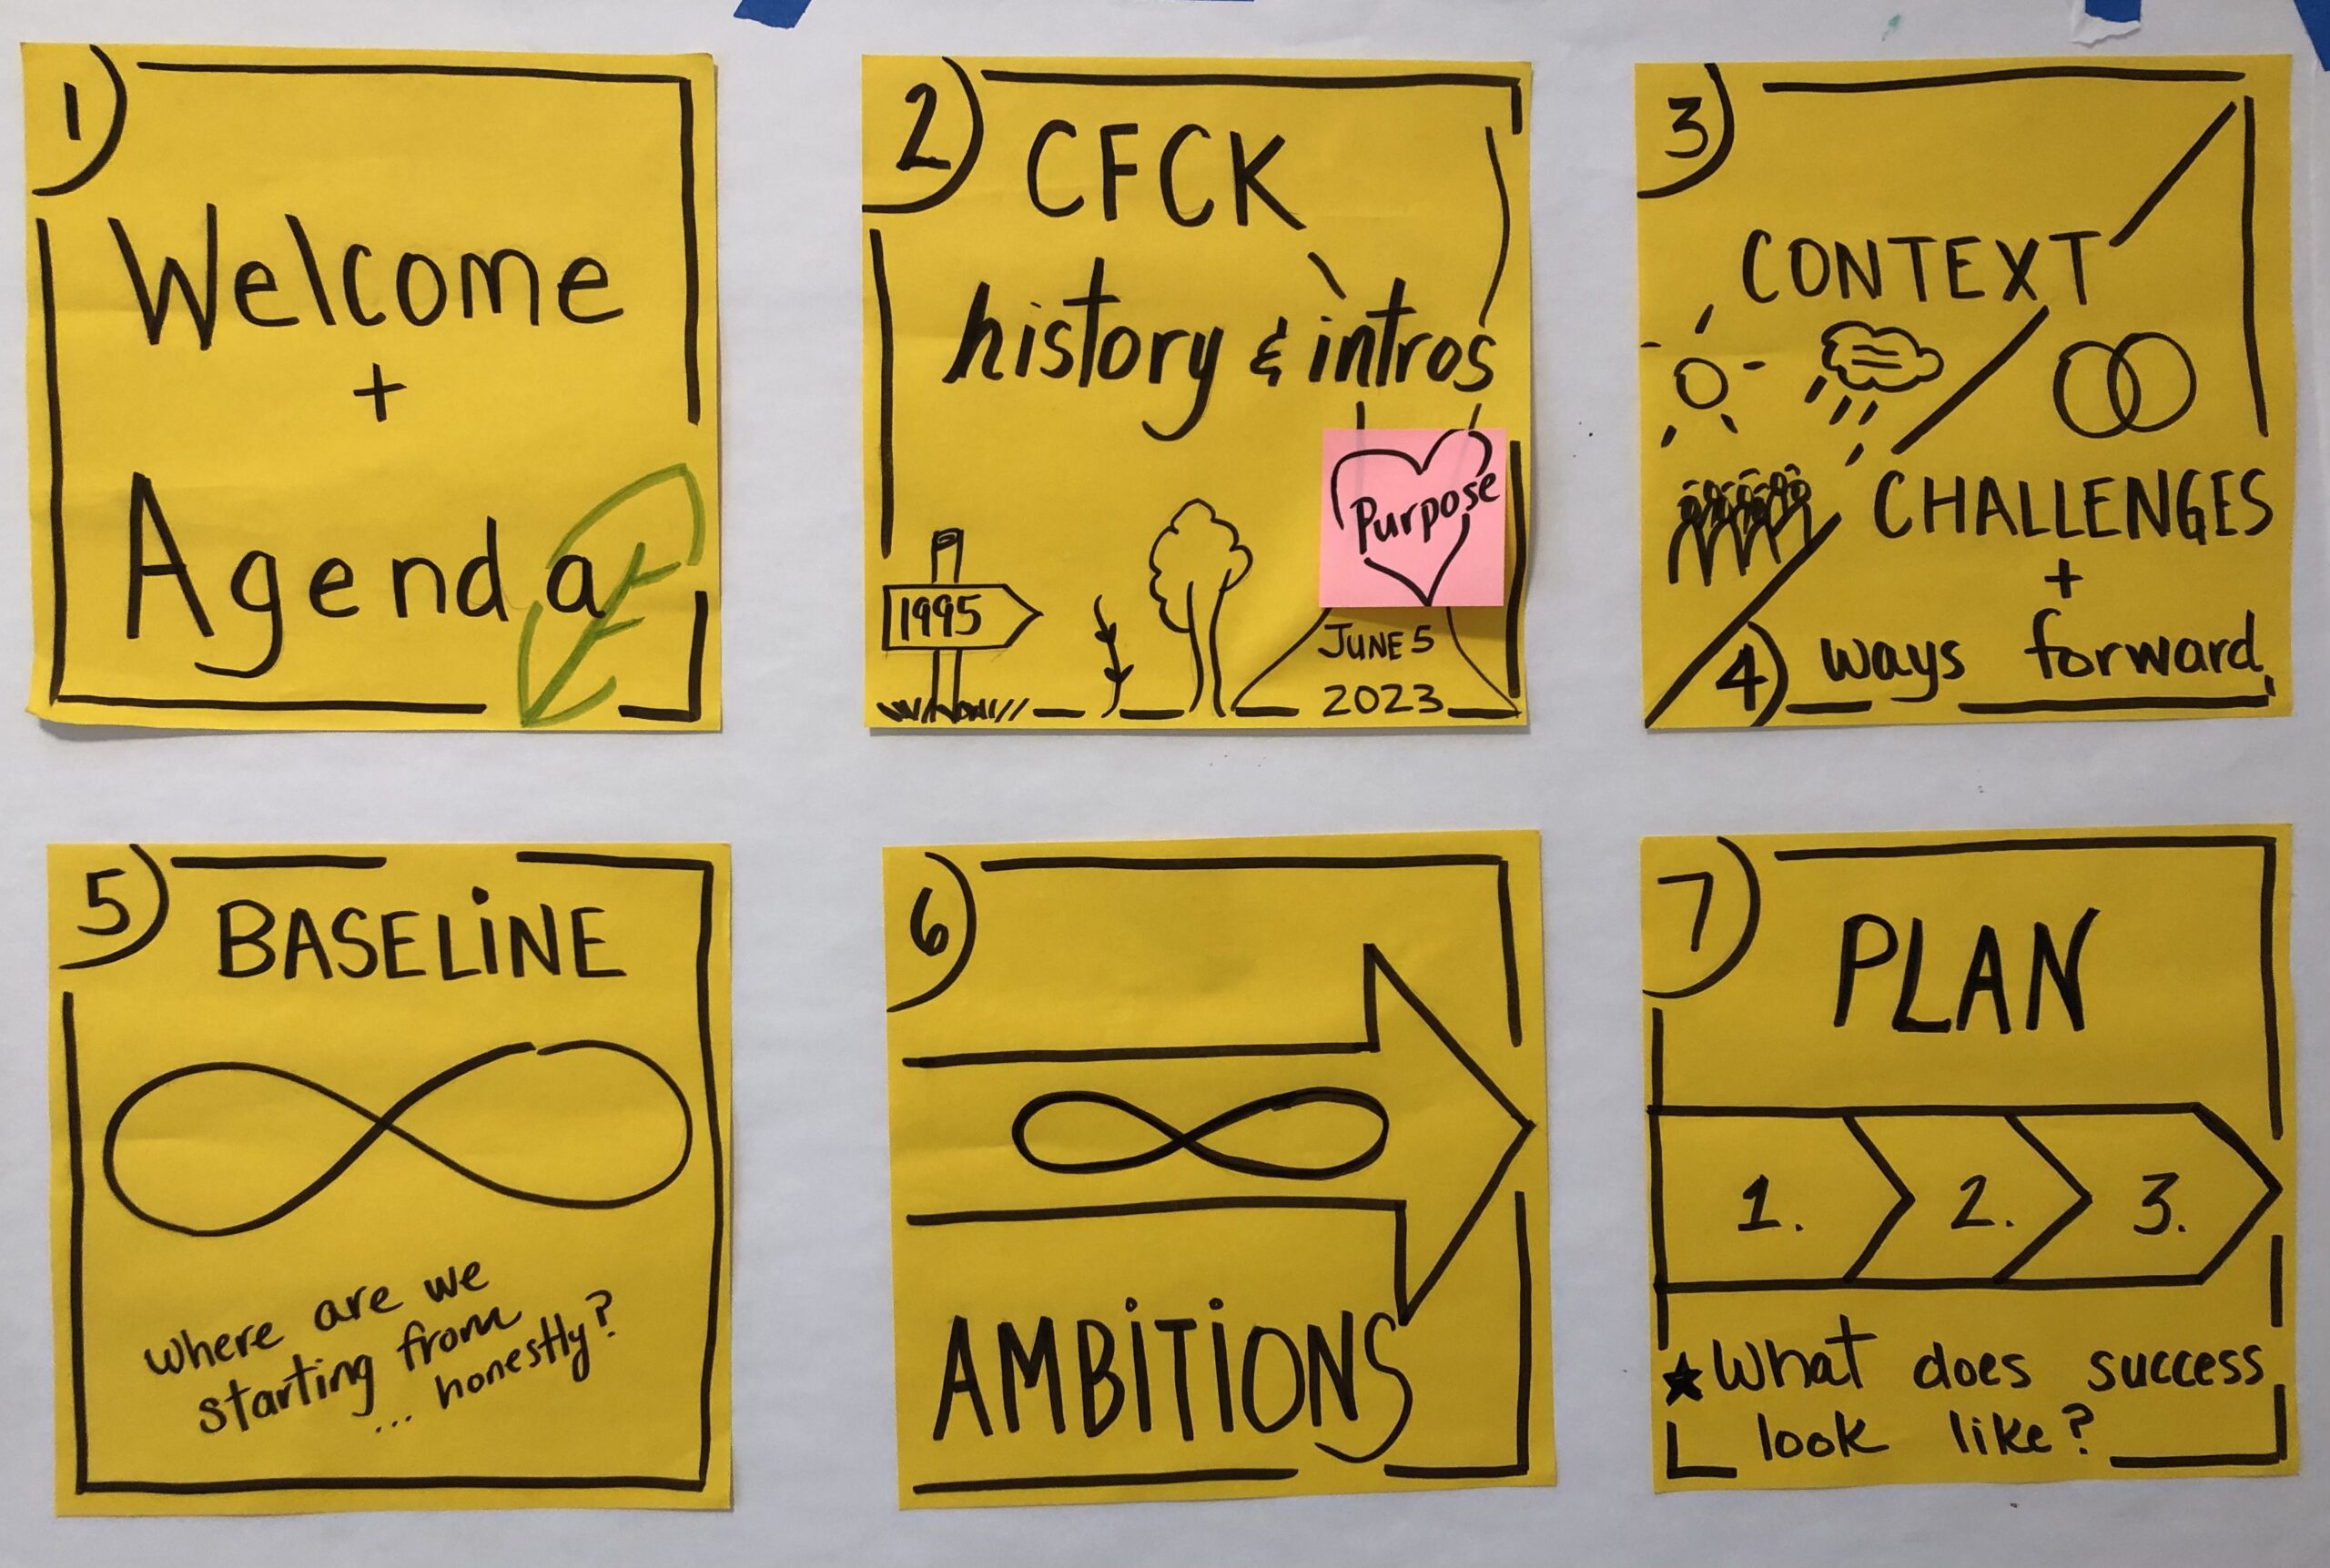
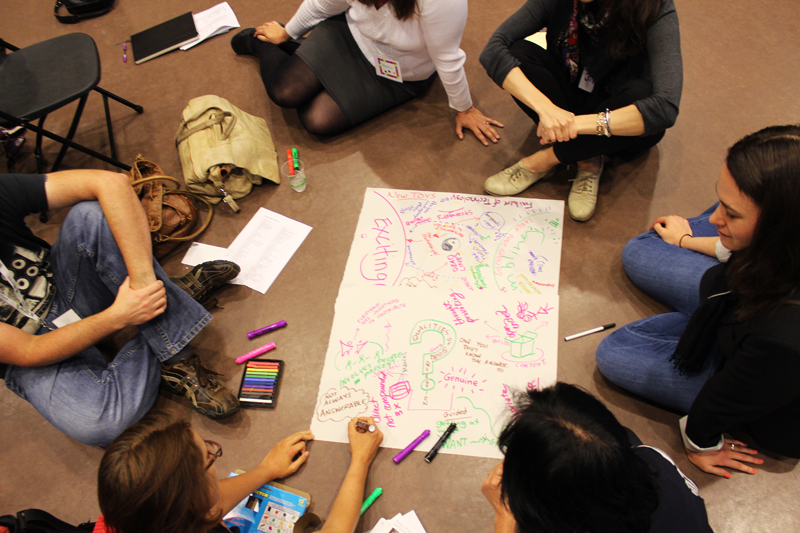
While I haven’t used the kanban board specifically as a tool, I have unintentionally done similar processes and I will certainly consider this in planning with the scientists. I have used the ecocycle a fair bit (and love it) though I think its not the best tool for our needs at this meeting. As far as visual facilitation, I will be brainstorming up numerous ways to embed this into our meeting to help us stay on track, communicate as a group, see the bigger picture and have more FUN!
If you are keen to learn more about visual facilitation / graphic facilitation, want to get the most out of your meetings and your planning, consider joining us to learn the basics of the art (no experience necessary) – July 9-10, 2018 in Rossland, BC, Canada.

1 thought on “Planning meetings? Can visuals help? Learn the basics at our 2018 Graphic Facilitation Workshop”
If you want your query or dilemma resolved instantly it is possible to
both use the livechat purpose or call them.